13 Oct 2026
Monthly Footfall Overview: September 2026
September saw mixed footfall trends across Bristol’s city centre, with Broadmead recording its highest monthly total so far this year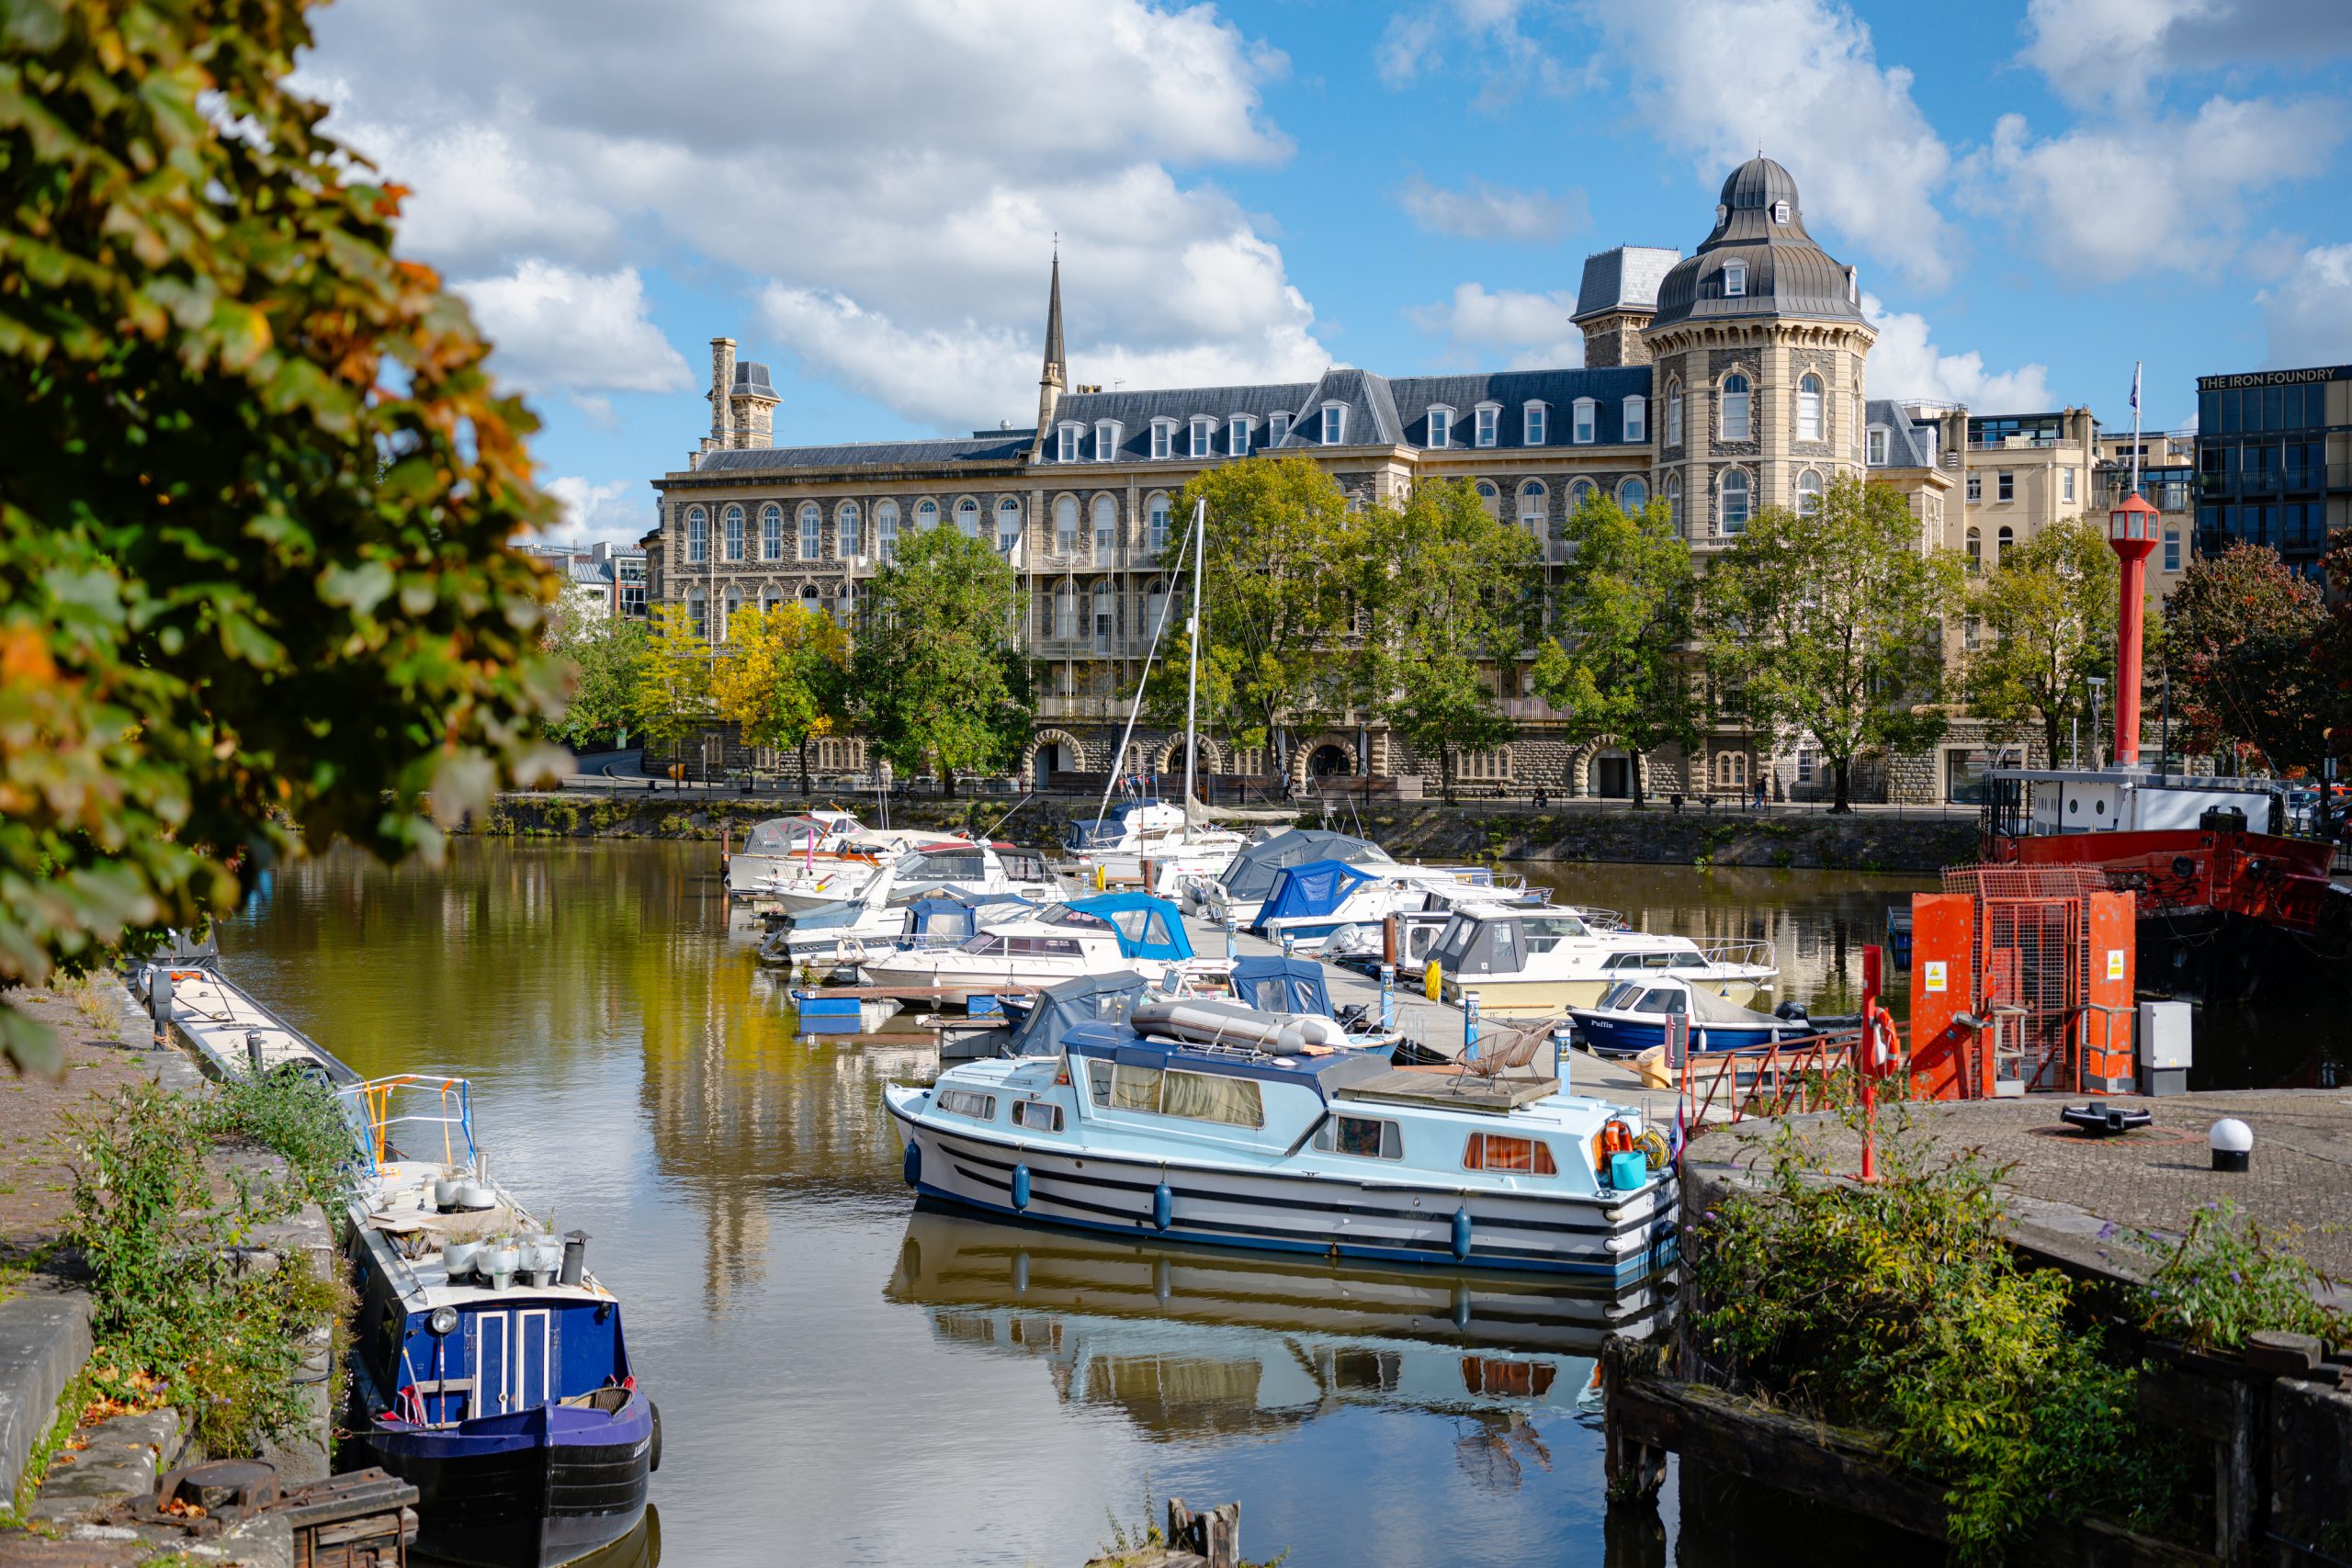
This September, Victoria Street saw a 3% decrease in footfall compared with August but remained 76% higher than September 2025, with daily visits averaging 12,717. Broadmead recorded a 23% increase compared with August, with Saturdays remaining the busiest days and footfall peaking during the week commencing 20 September, likely influenced by payday weekend and the return to school.
Victoria Street footfall is powered through Bristol BID’s investment in Micro Location Insights. An O2/Virgin Media sensor installed on Victoria Street provides valuable data that helps us understand footfall patterns and trends across the city.
We also capture data through two sensors in Broadmead, installed on Broadmead East and the corner of Broadmead West and Union Street (95 Broadmead). These sensors measure passing footfall by combining AI-powered algorithms with existing camera networks.
VICTORIA STREET
OVERALL TRENDS
Overall trends
Overall, there was a 3% decrease in footfall from August but a 76% increase from September 2025. The daily average visitor number was 12,717, slightly higher than 12,573 in August.
Key trends included:
- Peak footfall days: The busiest day for footfall was Tuesday 15th September, followed by Saturday 12th Wednesday 9th September, averaging 17, 368 visits, an 11% increase from August’s three highest days.
- End of Summer holidays: There was a 14% increase of works in the area from August, this can be explained by the end of summer holidays and the return to work of people.
VISITOR DEMOGRAPHICS & BEHAVIOUR
- Visitors were more likely to be younger than 65 compared with the national average.
- 23% of visitors were between the ages of 25-34, as compared to 17% nationally.
- 41% of visitors were female, and 59% were male.
- The most popular times to visit Victoria Street was lunchtime, between 12-1pm and evening commuting hours, between 5-6pm, on Tuesday, Wednesday and Thursday.
- The average dwell time was just under 34 minutes, up from 31 minutes in August, rising to 38 minutes when only ‘workers’ are included, compared to 34 minutes in August.
- Workers made up 14% of footfall in September compared to 12% in August, with ‘out of area visitors’ making up 76% in September compared to 74% in August.
SPENDING POWER & TRAVEL PATTERNS
- Victoria Street attracted a higher proportion of visitors with ‘high’ or ‘very high’ spending power compared with the national average.
- BS6 brought the highest number of visitors, followed by BS1 and BS4.
- The highest number of international visits was made from Spain, followed by Germany and France.
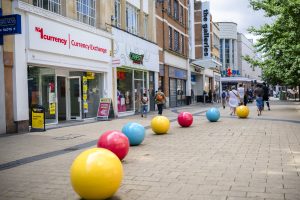
BROADMEAD
OVERALL TRENDS
The average daily footfall for Broadmead is divided between two sites: Broadmead East and 95 Broadmead.
In September, total footfall was 23% higher than in August. Broadmead East accounted for 77% of total footfall, while 95 Broadmead accounted for 23%. September achieved the highest monthly total so far this year.
Key trends included:
- Saturday impact: Saturdays were the highest days for footfall across both sites, with Saturday 26th September the busiest, followed by Saturday 12th and 12th and Tuesday 15th.
- End of Summer holidays: The week commencing the 20th reported the most footfall, with a 16% increase from the previous week.The key influencing factors are likely to be payday weekend and back-to-school season.
VISITOR DEMOGRAPHICS & BEHAVIOUR
- The most popular time to visit Broadmead was Saturdays between 2–4pm, which accounted for the highest average for footfall within the month.
- The average footfall between those hours on Saturday was 5170, this is 14% higher than August at 4420 between the hours of 1-3pm on Saturday.
Our Footfall & Insights pages are updated weekly with the latest footfall data. Please refer to our Reports & Resources section for a snapshot overview of footfall in our Monthly Visitor Reports and an overview of spend behaviours in our Quarterly Spend Reports.
The expanded footfall data can be viewed through our online dashboard for more effective and informed decision making. Please get in touch if you would like more information.