8 Jun 2026
Monthly Footfall Overview: May 2026
May saw positive footfall growth across the city, driven by strong performance on Victoria Street and Broadmead.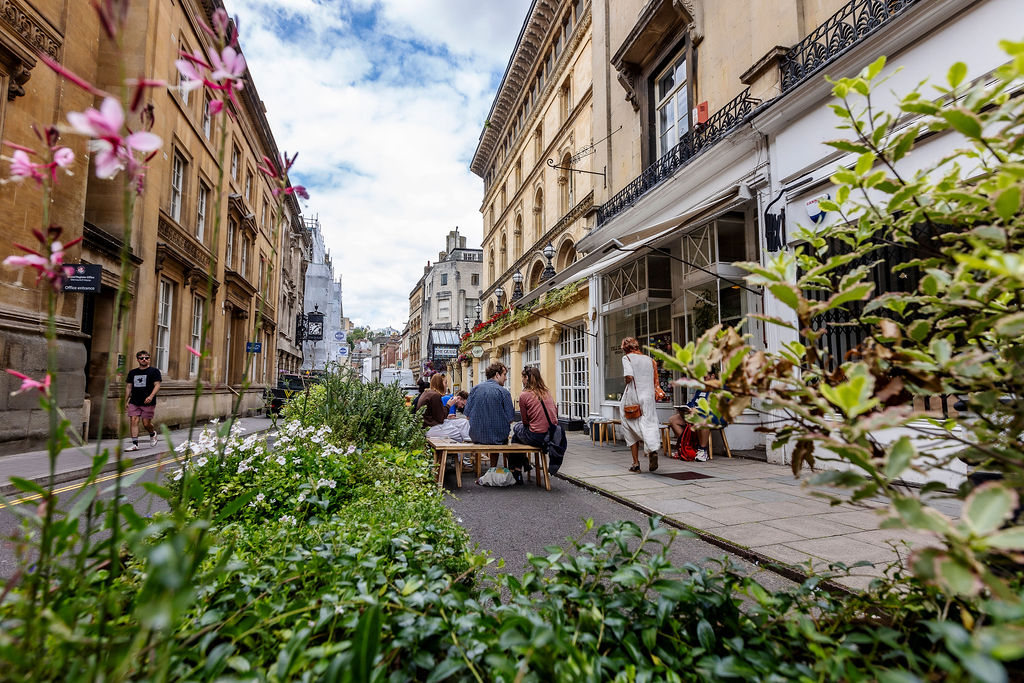
Overall, May showed positive footfall trends across Bristol’s key city centre locations. Victoria Street recorded strong growth compared to April, with significant increases in both footfall and international visitors, while Broadmead also saw an uplift, supported by half-term activity and strong weekend performance. Footfall on Park Street remained difficult to assess accurately due to ongoing sensor upgrades, although visitor behaviour and demographics remained broadly consistent with previous months. Saturdays continued to be the busiest days across most locations, with lunchtime, after-work and weekend afternoon periods driving the highest levels of activity.
Following our investment in Micro Location insights via O2/Virgin Media, two sensors have been installed on Victoria Street and Park Street, allowing us to better understand footfall trends across the city.
We also capture data through two sensors in Broadmead, installed on Broadmead East and the corner of Broadmead West and Union Street. These sensors measure passing footfall by combining AI-powered algorithms with existing camera networks.
PARK STREET*
*There is an ongoing issue with the Park Street sensor due to upgrades being carried out on the network. This has meant not all footfall is being recorded.
OVERALL TRENDS
Visitor patterns remained focused around weekend afternoons and weekday after work periods, while average dwell time increased slightly to just over 24.5 minutes. Out-of-area visitors accounted for 71% of footfall, consistent with April, and visitors continued to demonstrate relatively high spending power compared to the UK average. The majority of visitors came from Bristol postcode areas, particularly BS8 and BS6, with Spain remaining the leading source of international visits. Due to ongoing sensor issues, some visitor frequency data should be treated with caution.
Key trends included:
- Weekend impact: The busiest day for footfall were Saturdays followed by Sundays, showing the popularity of weekends on Park Street.
VISITOR DEMOGRAPHICS & BEHAVIOUR
- A higher percentage of visitors were aged 18-64 compared to the national average, while fewer were 65+.
- The most popular times to visit Park Street were 1 – 6pm on Saturdays and 12 – 4pm on Sundays, with weekdays after work between 5 – 6pm also a popular time.
- ‘Out of area’ visitors (those visiting rather than working or residing nearby) made up 71% of visits, comparable to April. This decreased to 68% on Saturdays, which is a different pattern to what we normally see, where the weekend brings more people from out of the area to Park Street – this could be due to the sensor issues.
- Saturday and Sunday afternoons were the most popular time for out of area visitors.
- The average dwell time was just over 24 and a half minutes, around 1 minute longer than in April.
- 44% of visitors were female, down from 45% in April and compared to 51% nationally.
SPENDING POWER & TRAVEL PATTERNS
- Compared to the UK average, Park Street visitors had a ‘high’ or ‘very high’ spend power.
- When comparing the spending power of different categories of visitor, ‘residents’ had the highest average, followed by ‘visitors’ and then ‘workers’.
- 79% of visitors made 1 visit, 20% made 2-5 visits, 1% made 6-10 visits, and no one was recorded as visiting over 11 times, although this could be incorrect due to the sensor issues.
- The BS8 postcode brought the highest number of visitors to Park Street, followed by BS6.
- 73% of visitors came from the Bristol area, up from 70% in April. 3% came from Bath and 2% from Gloucester postcodes.
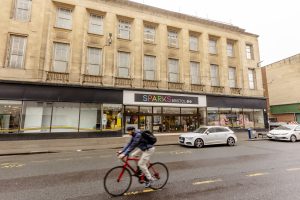
VICTORIA STREET
OVERALL TRENDS
Overall, there was a 26% increase in footfall from April and the same increase in unique visitor numbers, meaning on average each person visited the area with a similar frequency. The daily average visitor number was 11,338 compared to 9,315 in April. Additionally, there was an 84% increase from May 2025, which was 6,178.
Key trends included:
- Peak footfall days: The busiest days for footfall in May were Friday 29th and Saturday 30th May, followed by Wednesday 6th May.
- Weekday impact: Wednesdays had the highest footfall across the week, with Sundays the lowest.
VISITOR DEMOGRAPHICS & BEHAVIOUR
- A higher percentage of visitors were aged 18-54 compared to the national average, while fewer were 55+.
- 42% of visitors were female, compared to 51% nationally.
- The most popular time to visit Victoria Street were Tuesday – Friday lunchtimes, between 1-2pm and after work between 5-6pm, along with Saturday afternoons and evenings.
- The average dwell time was 32 and a half minutes, which was slightly longer than April.
- The percentage of visits made by ‘out of area visitors’ (people whose location settings puts them as visiting Victoria Street rather than working or residing there) was 74%, same as in April. This figure rose to 83% on weekends.
SPENDING POWER & TRAVEL PATTERNS
- Compared to the national average, Victoria Street attracted a larger proportion of visitors with ‘high’ or ‘very high’ spend power.
- Compared to May 2025, a much smaller proportion of visitors to Victoria Street has a ‘very low’ spending power.
- ‘Visitors’ had the highest average, followed by ‘residents’ and then ‘workers’.
- 61% of visitors made 1 visit, 32% made 2-5 visits, 5% made 6-10 visits, and 2% made 11+ visits.
- The BS4 postcode brought the highest number of visitors, followed by BS3.
- 59% of visitors to Victoria Street came from the Bristol area, 5% came from Bath postcodes and 3% from Gloucester postcodes.
- Footfall from international visits was 27% higher than in April. The largest number of international visits were made from Spain.
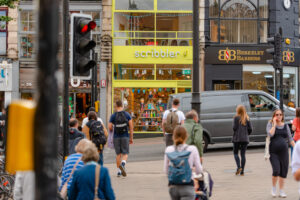
BROADMEAD
OVERALL TRENDS*
The average daily footfall for Broadmead is divided between two sites: Broadmead East and 95 Broadmead.
In May, the total footfall was 4% higher than in April. Broadmead East accounted for 74% of the total footfall and 95 Broadmead accounted for 26%. Across both sites, footfall was 3% lower than in May 2025.
Key trends included:
- Saturday impact: Saturdays were the highest day for footfall for both sites, with Saturday 9th being the busiest, followed by Saturday 2nd.
- Weather impact: A clear drop is seen during the week commencing 11th, including Saturday 16th which saw a lower footfall than other Saturdays. This week saw cooler temperatures and more rain which could explain the lower number of visitors.
VISITOR DEMOGRAPHICS & BEHAVIOUR
- The most popular time to visit Broadmead was Saturdays between 1-3pm, with weekday lunchtimes between 1-2pm and after work between 5-6pm also seeing spikes.
- Sundays were the quietest days.
Our Footfall & Insights pages are updated weekly with the latest footfall data. Please refer to our Reports & Resources section for a snapshot overview of footfall in our Monthly Visitor Reports and an overview of spend behaviours in our Quarterly Spend Reports.
The expanded footfall data can be viewed through our online dashboard for more effective and informed decision making. Please get in touch if you would like more information.