24 Sep 2026
Bristol BID Economic Insights: Q2 2026
New transaction data from Savills reveals consumer spending across the Bristol BID area.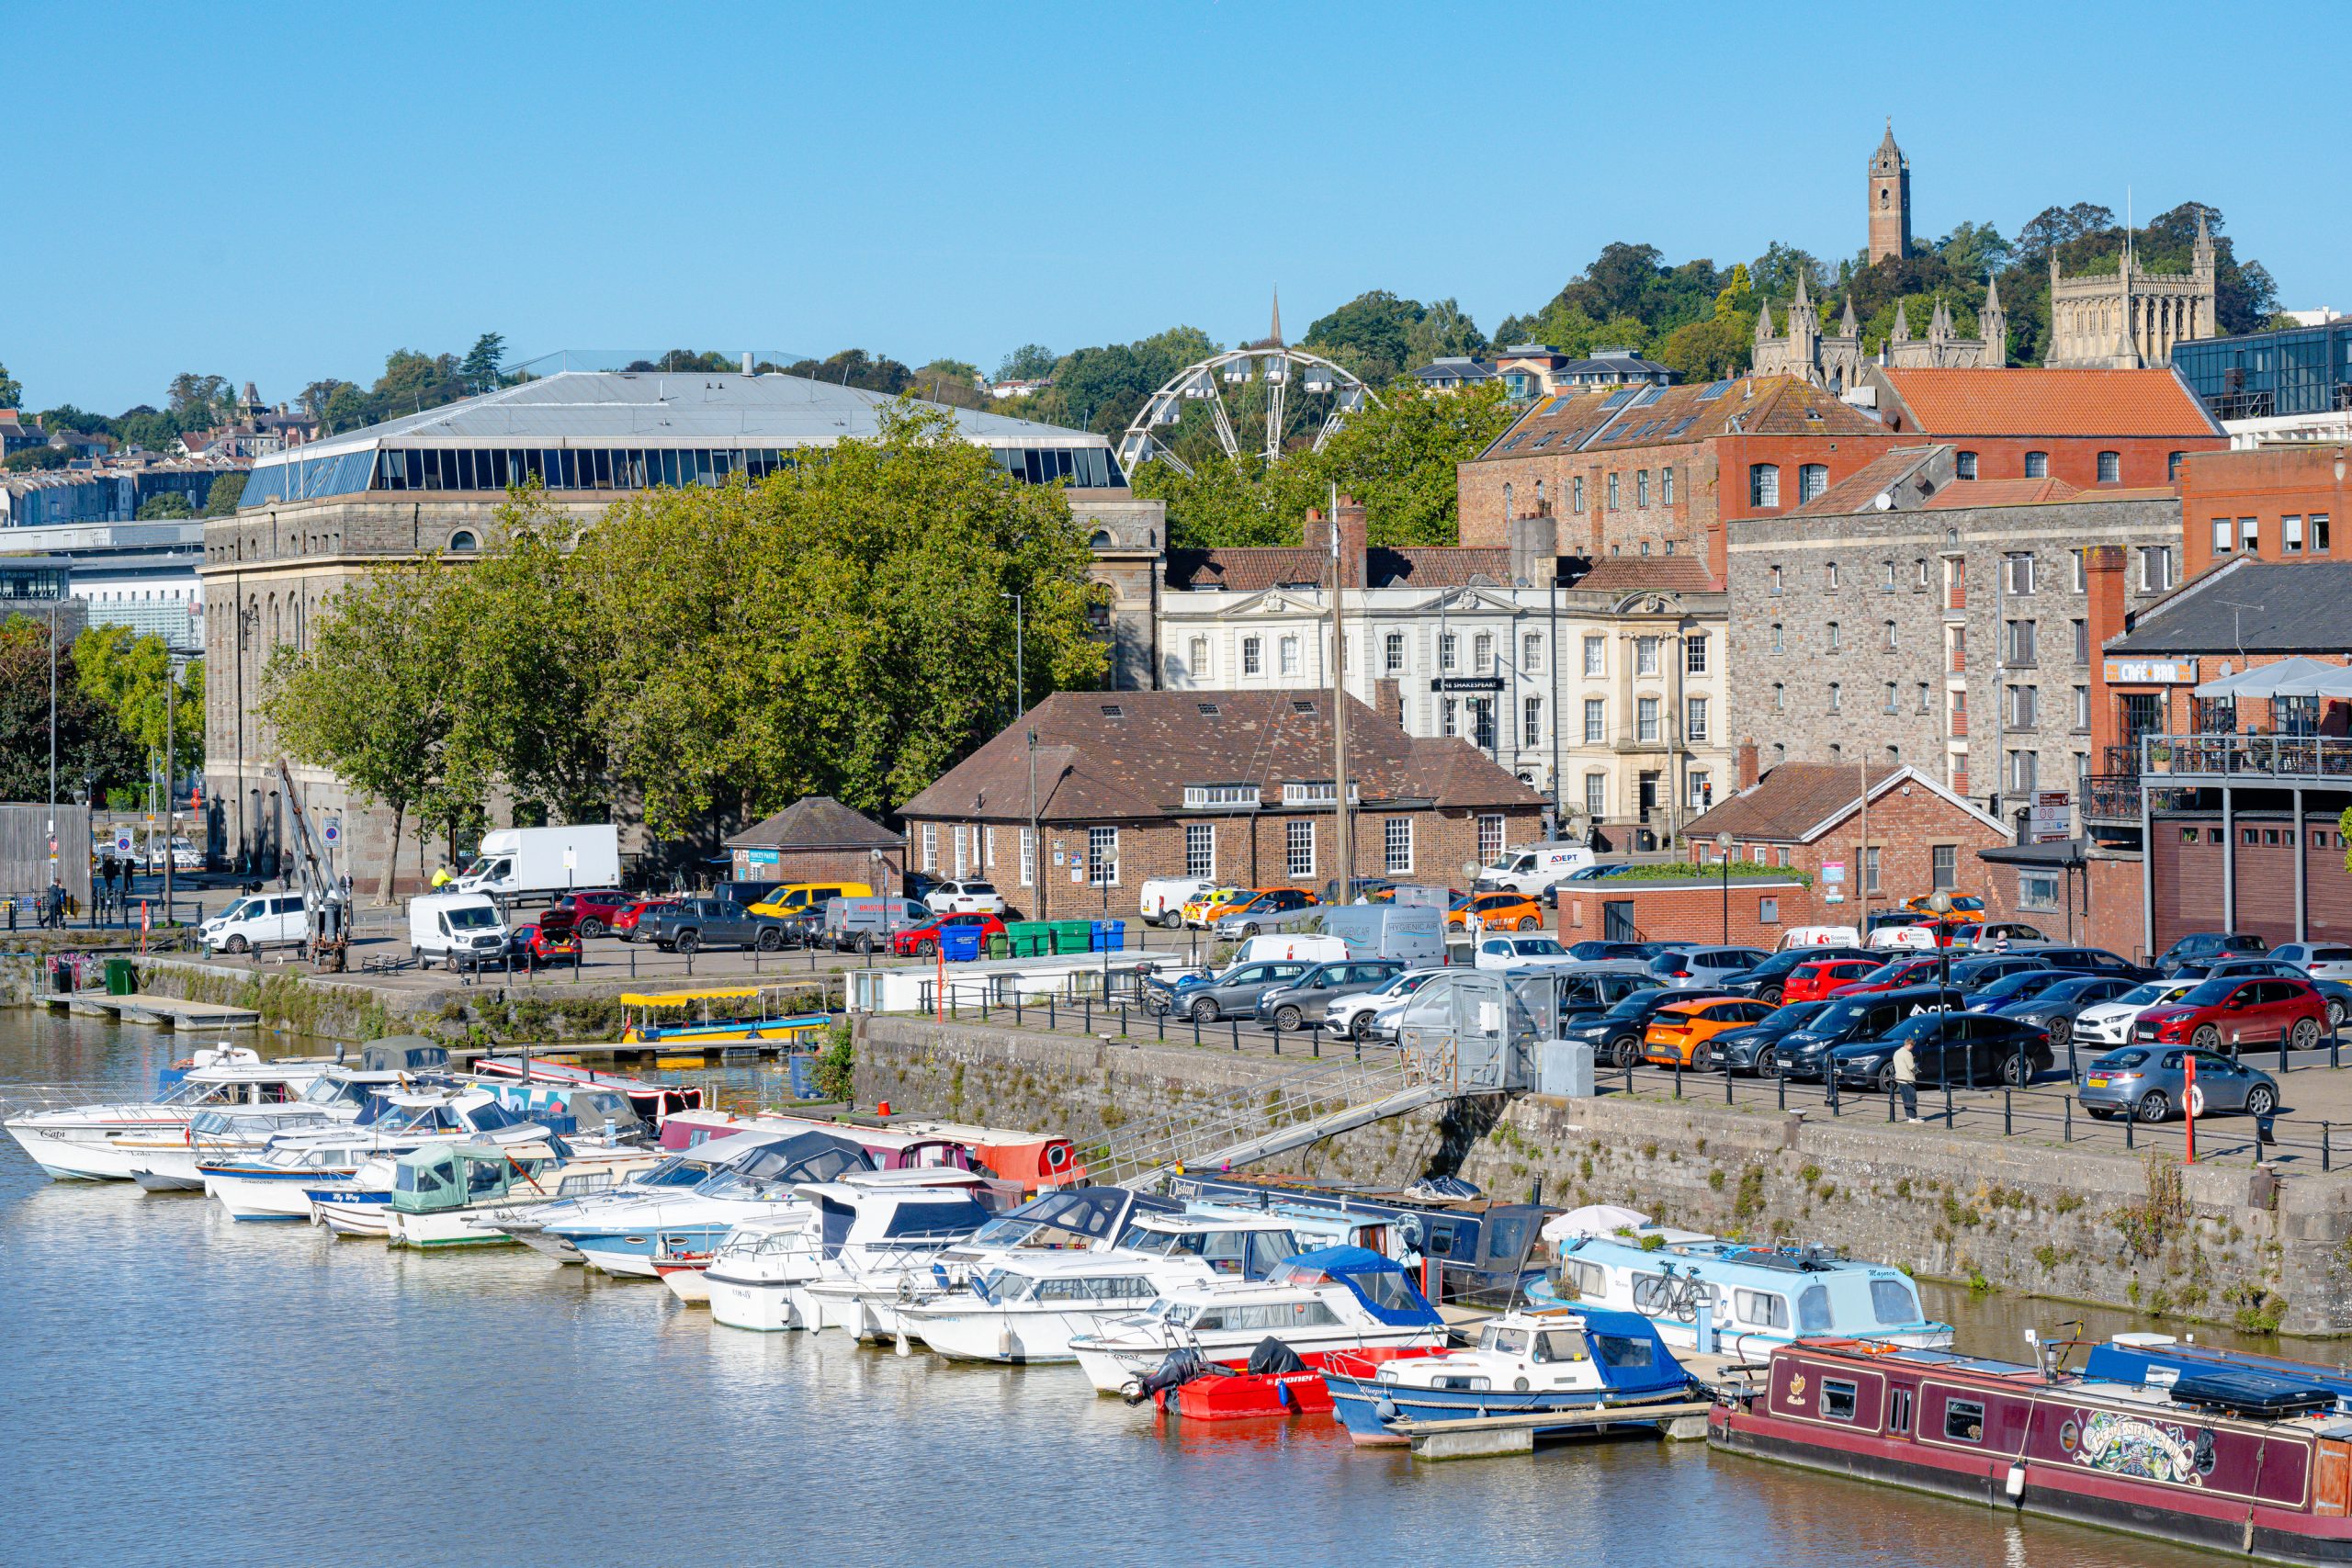
New transaction data from Savills reveals consumer spending across the Bristol BID area in Quarter 2 averaged £22.4 million, compared to the same period in 2025 where the area averaged £26.3 million, a drop of 14%.
The average spend per domestic consumer in the BID area was £45.77 for the quarter in line with performance in Q1 and a 6% decrease compared to the same quarter in 2025.
We also have access to data from neighbouring locations as outlined below (please note these are not direct comparisons as categories and size of areas differ):
| Location | Average Spend per Person | Average Domestic Consumer Transaction Value |
|---|---|---|
| Cardiff | £69.47 | £20.00 |
| Bath | £72.22 | £20.00 |
| Bristol BID | £45.77 | £18.00 |
| The Mall | £63.74 | £27.00 |
Compared to Q2 2025, Jewellery and Footwear enjoyed the strongest growth. Conversely, Groceries and Giftware/Cards saw the sharpest contractions, signalling that shoppers are tightening their belts on daily essentials and gifting.
Customer loyalty remains steady, with 25.6% of all quarterly transactions coming from repeat customers returning to the same businesses.
Midday is still the most popular time for retailers, capturing 32% of the total daily spend between 12pm – 2pm, with the categories split as follows:
- 48% of Card & Gift sales
- 47% of Jewellery shopping
- 44% of Shoe store sales
- 40% of Clothing purchases
- 38% of Bakery and Beauty/Barber shop visits
Evenings (6pm–11pm) account for 17% of overall spend, while late-night (11pm–6am) brings in 4%. For the night-time economy the category split is:
- 48% of all Restaurant spending is between 6pm – 11pm
- 35% of Hotel & Accommodation transactions (11pm – 6am)
- 38% of sales at Corner Shops and Mini-Supermarkets (11pm – 6am)
- 27% of Fast-Food spend (11pm – 6am)
Spending can also be tracked according to the area demographic and infrastructure:
- BS8 1 (Clifton Triangle / Queens Road): Heavily influenced by the local student population, this district saw evening spending peak at 28% in May (overall 24%). This was broadly in line with Q1 at 25%.
- BS1 (Central Core): Maintained a balanced evening spend of 19% and claimed the city’s highest late-night footprint at 5%.
- BS2 0 (Commercial Hub): 28% of transactions happen in the morning, and 35% occur at lunch, with evenings dropping to 8%.
We can further analyse where this spend is coming from below:
- For BS1: Residents from Easton, St George, and Whitehall generated the most economic activity (£7.2m total in Q2), followed by Downend, Fishponds, and Frenchay (£4.5m).
- For BS8 1 (Clifton): The top spending pipeline flowed from Redland, Montpelier, and Westbury Park.
- For BS2 0: Again, we see activity coming from Easton, St George, and Whitehall, followed by a little further afield in Brislington, Knowle, Knowle West, and St Annes.
Total volume from international visitors saw quite significant changes compared to Q2 2025. Chinese spending dropped by 51%, and the US, while still the top international spender by overall volume above China, dropped by 21% year-on-year. The Republic of Ireland followed as the next highest volume contributor.
Businesses should note that while the Middle East and parts of Europe show lower tourist numbers, their average spend is higher.
The highest average transaction values came from:
- Qatar: £45 average per transaction (£25k total spend)
- Croatia: £42 average per transaction (£16k total spend)
- United Arab Emirates: £38 average per transaction (£139k total spend)
If you want further detail on any of the above, or would like to enquire about specific data, please email info@bristolbid.co.uk