8 Apr 2026
Monthly Footfall Overview: March 2026
Warmer weather boosted footfall activity throughout.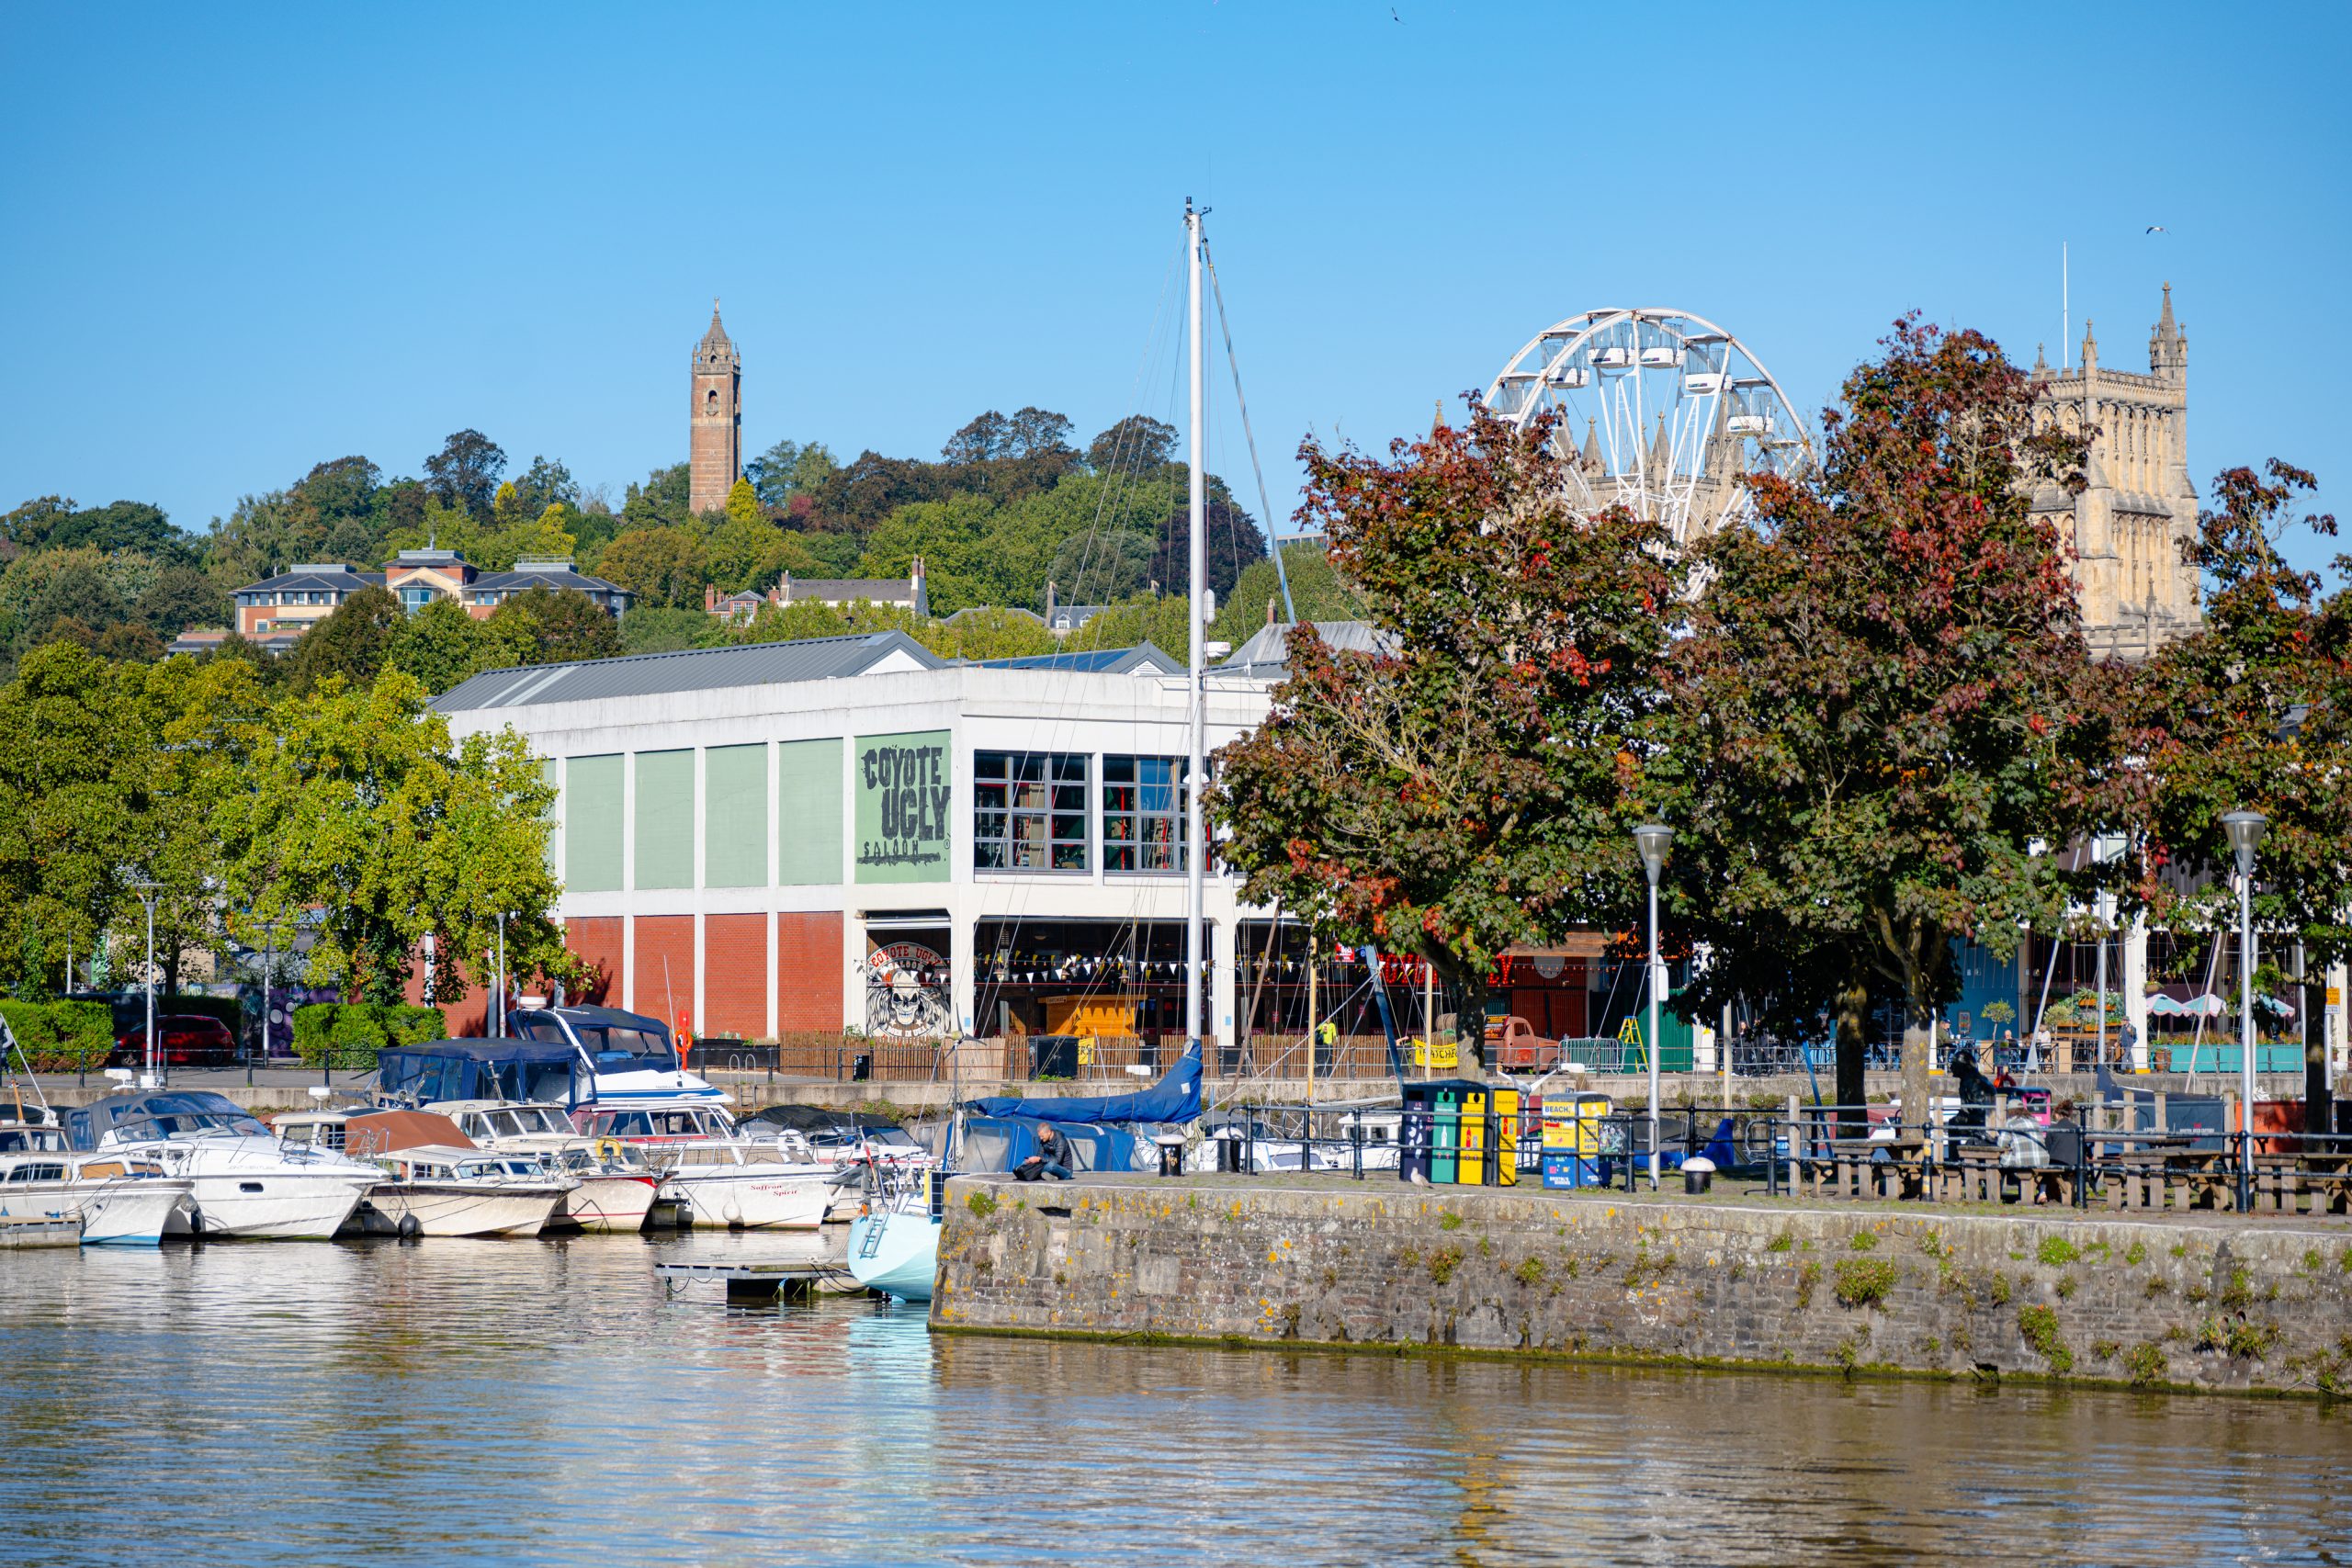
Overall, March showed broadly positive but varied footfall trends across the city. Park Street recorded strong growth compared to February, although figures earlier in the year were impacted by a temporary sensor issue, and levels remained significantly below March 2025. In contrast, Victoria Street saw a notable increase both month on month and year on year figures, while Broadmead experienced a slight increase from February but a slight decrease compared to last year. Warmer weather and seasonal activity helped boost footfall, with Saturdays consistently the busiest days across most locations, alongside strong lunchtime and after-work peaks during the week.
Following our investment in Micro Location insights via O2/Virgin Media, two sensors have been installed on Victoria Street and Park Street, allowing us to better understand footfall trends across the city.
We also capture data through two sensors in Broadmead, installed on Broadmead East and the corner of Broadmead West and Union Street. These sensors measure passing footfall by combining AI-powered algorithms with existing camera networks.
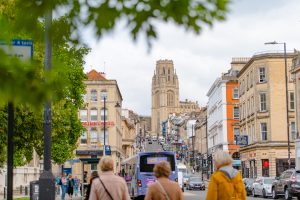
PARK STREET*
*There was an issue with the Park Street sensor in weeks 5 and 6 of 2026, meaning the last week of January and first week of February reported artificially low footfall. From 11th February onwards the issue was resolved and true footfall reported.
OVERALL TRENDS
Compared to February, footfall on Park Street was up 29% with a 15% increase in unique visitors, meaning the average number of visits per person increased. The daily average visitor number was 7,173, compared to 6,143 in February. However, there was a 58% decrease this month compared to March 2025 where the daily average was 17,050 visitors.
Key trends included:
- Seasonal events: The busiest day for footfall was Saturday 14th, with the other Saturdays also being very popular, showing the popularity of weekends on Park Street. Throughout the month, there was a consistent pattern of higher footfall on Fridays and Saturdays, and low footfall on Sundays. Warm weather in the middle of the month likely contributed to higher weekday footfall than average.
- International visits: There was a 30% increase in footfall from international visitors in March compared to February, which is likely due to nicer weather and the start of Spring. The largest number of visitors came from Spain, similar to previous months.
VISITOR DEMOGRAPHICS & BEHAVIOUR
- A higher percentage of visitors were aged 18-64 compared to the national average, while fewer were 65+.
- The most popular time to visit Park Street was 1-5pm on Saturdays, with weekdays after work between 5-6pm also a popular time.
- ‘Out of area’ visitors (those visiting rather than working or residing nearby) made up 70% of visits, up from 69% in February. This rose up to 80% on Saturdays, showing that people predominantly travel to Park Street on the weekend.
- Saturdays between 12-7pm were the most popular time for out of area visitors.
- The average dwell time was just over 24 minutes, similar to February.
- 44% of visitors were female, compared to 51% nationally.
SPENDING POWER & TRAVEL PATTERNS
- Compared to the UK average, Park Street visitors had a ‘high’ or ‘very high’ spend power.
- When comparing the spending power of different categories of visitor, ‘residents’ had the highest average, followed by ‘visitors’ and then ‘workers’.
- 64% of visitors made 1 visit, 30% made 2-5 visits, 4% made 6-10 visits, and 1% visited over 11 times. This aligns with an increase in average visits per visitor from February to March.
- The BS8 postcode brought the highest number of visitors to Park Street, followed by BS6.
- 64% of visitors came from the Bristol area, down slightly from 71% in February, showing more people travelled from out of the area to visit this month. 3% came from Bath and 2% from Gloucester postcodes.
VICTORIA STREET
OVERALL TRENDS
Overall, there was a 30% increase in footfall from February and a 16% increase in unique visitor numbers, meaning on average each person visited the area more frequently. The daily average visitor number was 8,390, compared to 7,575 in February. Additionally, there was an 87% increase from March 2025, which was 4,466.
Key trends included:
- Seasonal events: The busiest days for footfall in February were Tuesday 17th and Wednesday 18th, followed by Saturday 14th. The week commencing 16th March had the highest overall footfall, coinciding with mostly warm, sunny weather throughout.
- Weekday impact: Tuesdays and Wednesdays had the highest footfall across the week, with Sundays the lowest.
VISITOR DEMOGRAPHICS & BEHAVIOUR
- A higher percentage of visitors were aged 18-64 compared to the national average, while fewer were 65+.
- 41% of visitors were female, compared to 51% nationally.
- The most popular time to visit Victoria Street were Monday-Thursday lunchtimes, between 1-2pm and after work between 5-6pm, and Saturdays between 1-7pm.
- The average dwell time was just under 32 minutes, which was 5 minutes longer than in February.
- The percentage of visits made by ‘out of area visitors’ (people whose location settings puts them as visiting Victoria Street rather than working or residing there) was 70%, down from 72% in February.
SPENDING POWER & TRAVEL PATTERNS
- Compared to the national average, Victoria Street attracted a larger proportion of visitors with ‘high’ or ‘very high’ spend power. Compared to March 2025, a much smaller proportion of visitors to Victoria Street has a ‘very low’ spending power.
- ‘Visitors’ had the highest average, followed by ‘residents’ and then ‘workers’.
- 63% of visitors made 1 visit, 30% made 2-5 visits, 5% made 6-10 visits, and 2% made 11+ visits, which ties in with the average number of visits per person being higher this month.
- The BS4 postcode brought the highest number of visitors, followed by BS3.
- 59% of visitors to Victoria Street came from the Bristol area, compared to 63% in February. 5% came from Bath postcodes and 3% from Gloucester postcodes.
- Footfall from international visits was 9% higher this month compared to February. Similar to Park Street, the largest number of international visits were made from Spain.
BROADMEAD
OVERALL TRENDS*
The average daily footfall for Broadmead is divided between two sites: Broadmead East and 95 Broadmead.
In March, the total footfall was 10% higher than in February. Broadmead East accounted for 74% of the total footfall and 95 Broadmead accounted for 26%. Across both sites, footfall was 2% lower than in March 2025.

Key trends included:
- Saturday impact: Saturdays were the highest day for footfall for both sites, with Saturday 14th being the busiest, followed by Saturdays 21st and 28th March.
- Seasonal events: The Big Broadmead Spring Clean took place between the 23rd and 29th March, where volunteers litter picked, improved green spaces and refreshed the paint around Broadmead, likely driving footfall over that period.
VISITOR DEMOGRAPHICS & BEHAVIOUR
- The most popular time to visit Broadmead was Saturdays between 1-4pm and weekday lunchtimes between 1-2pm, which suggests people visiting the area during their lunch break.
- Sundays were the quietest days.
- The spread of footfall across the week this month was very similar to March 2025, which also saw Saturdays to be the busiest days, and Sundays the least
Our Footfall & Insights pages are updated weekly with the latest footfall data. Please refer to our Reports & Resources section for a snapshot overview of footfall in our Monthly Visitor Reports and an overview of spend behaviours in our Quarterly Spend Reports.
The expanded footfall data can be viewed through our online dashboard for more effective and informed decision making. Please get in touch if you would like more information.
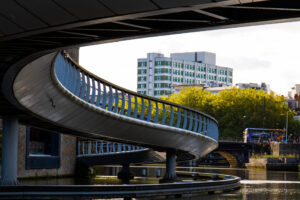
Main image: Shotaway ; in-text image 3: Ciara Hillyer