11 Mar 2026
Monthly Footfall Overview: February 2026
Overall, February showed mixed footfall trends across the city. Park Street saw a decline compared to January, although figures were affected by a temporary sensor fault early in the month.
Victoria Street and Broadmead both recorded increases in footfall despite February being shorter. Key events such as Valentine’s Day and the Bristol Light Festival helped drive footfall activity, with Saturdays continuing to see the highest visitor numbers.
Following our investment in Micro Location insights via O2/Virgin Media, two sensors have been installed on Victoria Street and Park Street, allowing us to better understand footfall trends across the city.
We also capture data through two sensors in Broadmead, installed on Broadmead East and the corner of Broadmead West and Union Street. These sensors measure passing footfall by combining AI-powered algorithms with existing camera networks.
PARK STREET*
OVERALL TRENDS
Compared to January, footfall on Park Street was down 14% with a 1% increase in unique visitors, meaning the average number of visits per person decreased slightly. The daily average visitor number was 6,143 compared to 6,439 in January. Additionally, there was a 33% decrease this month compared to February 2025 where the daily average was 9,437 visitors. However, the faulty sensor means these numbers are not fully accurate.
*There was an issue with the Park Street sensor in weeks 5 and 6 of 2026, meaning the last week of January and first week of February reported artificially low footfall. From 11th February onwards the issue was resolved and true footfall reported.
Key trends included:
- Seasonal events: The busiest day for footfall was Valentine’s Day on Saturday 14th, showing the impact of people going out to celebrate. Saturdays 21st and 28th were also very popular days and both coincided with Bristol Light Festival which ran between the 19th-28th February and contributed to an increase in visitors. No particular variation in footfall was seen over the half term week between the 16th-20th.
- International visits: There was an 18% decrease in footfall from international visitors in February compared to December, which is unsurprising as people are likely to have travelled over the Christmas holidays. The largest number of visitors came from Spain, similar to previous months.
VISITOR DEMOGRAPHICS & BEHAVIOUR
- A higher percentage of visitors were aged 18-64 compared to the national average, while fewer were 65+.
- The most popular time to visit Park Street was 2-5pm on Saturdays, with Tuesday – Friday evenings between 5-7pm also a popular time. This was later compared to January , possibly due to Bristol Light Festival taking place from 5-9.30pm.
- ‘Out of area’ visitors (those visiting rather than working or residing nearby) made up 69% of visits, up from 63% in January. This percentage rose up to 71% over Bristol Light Festival, indicating people may have chosen to visit for that purpose.
- Saturdays between 1-7pm were the most popular time for out of area visitors.
- The average dwell time was just over 24 minutes, similar to January.
- 44% of visitors were female, compared to 51% nationally.
SPENDING POWER & TRAVEL PATTERNS
- Compared to the UK average, Park Street visitors had a ‘high’ or ‘very high’ spend power.
- When comparing the spending power of different categories of visitor, ‘residents’ had the highest average, followed by ‘visitors’ and then ‘workers’.
- 68% of visitors made 1 visit, 28% made 2-5 visits, 3% made 6-10 visits, and 1% visited over 11 times. This aligns with a small decrease in average visits per visitor from January to February.
- The BS8 postcode brought the highest number of visitors to Park Street, followed by BS6.
- 71% of visitors came from the Bristol area, down slightly from 82% in January, showing more people travelled from out of the area to visit this month. 3% came from Bath and 2% from Gloucester postcodes.
VICTORIA STREET
OVERALL TRENDS
Overall, there was an 8% increase in footfall from January and a 20% increase in unique visitor numbers, despite February being a shorter month, meaning on average each person visited the area less frequently. The daily average visitor number was 7,575 in February, compared to 6,328 in January. Additionally, there was a 340% increase from February 2025, which was 1,715.
Key trends included:
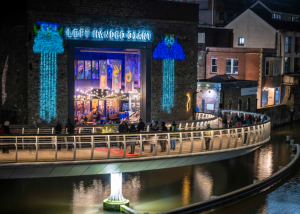
- Seasonal events: The busiest days for footfall in February were Saturday 28th followed by Tuesday 24th and Wednesday 25th, with the week commencing 23rd February having the highest footfall of the month. The Bristol Light Festival ran from 19-28th February, likely impacting the number of visitors. Although there were no installations on Victoria Street, people likely used this route to reach other areas, such as Left Handed Giant and the Clockwise Building. Similar to Park street, no particular variation was seen over the half term week.
- Weekday impact: Sundays were the lowest days for footfall, with a significant drop in visits, with the three quietest days all being Sundays.
VISITOR DEMOGRAPHICS & BEHAVIOUR
- A higher percentage of visitors were aged 18-54 compared to the national average, while fewer were 55+.
- 43% of visitors were female, compared to 51% nationally.
- The most popular time to visit Victoria Street was Saturdays between 12-9pm, and Monday-Thursday lunchtime (1-2pm) and after work between 5-6pm.
- The average dwell time was just under 26 minutes, 4 minutes shorter than in January.
- The percentage of visits made by ‘out of area visitors’ (people whose location settings puts them as visiting Victoria Street rather than working or residing there) was 72%, up from 64% in January and rising to 74% for the duration of Bristol Light Festival.
SPENDING POWER & TRAVEL PATTERNS
- Compared to February 2025, Victoria Street attracted a larger proportion of visitors with ‘high’ or ‘very high’ spend power.
- ‘Visitors’ had the highest average, followed by ‘residents’ and then ‘workers’.
- 67% of visitors made 1 visit, 28% made 2-5 visits, 4% made 6-10 visits, and 1% made 11+ visits, which ties in with the average number of visits per person being lower this month.
- The BS4 postcode brought the highest number of visitors, followed by BS3.
- 63% of visitors to Victoria Street came from the Bristol area, up from 66% in January. 6% came from Bath postcodes and 3% from Gloucester postcodes.
- Footfall from international visits was slightly lower this month. Similar to Park Street, the largest number of international visits were made from Spain.
BROADMEAD
OVERALL TRENDS*
The average daily footfall for Broadmead is divided between two sites: Broadmead East and 95 Broadmead.
In February, the total footfall was 4% higher than in January, despite there being 3 fewer days in the month. Broadmead East accounted for 74% of the total footfall and 95 Broadmead accounted for 26%. Broadmead East saw a 2% higher footfall than February 2025 and 95 Broadmead saw 1% lower.
Key trends included:
- Saturday impact: Saturdays were the highest day for footfall for both sites, with Saturday 28th being the busiest, followed by Saturdays 7th and 14th February, which is comparable to the data collected from Park Street and Victoria Street.
- Seasonal events: The weekdays between 16th – 20th February, were 23% busier on average than the rest of the weekdays throughout the month, which coincides with school half term.
VISITOR DEMOGRAPHICS & BEHAVIOUR
- The most popular time to visit Broadmead was Saturdays between 1-4pm and weekday lunchtimes between 1-2pm, which suggests people visiting the area during their lunch break.
- Sundays were the quietest days.
- The spread of footfall across the week this month was very similar to February 2025, which also saw Saturdays to be the busiest days, and Sundays the least.
*Bristol Light Festival did not encompass Broadmead this year, although footfall may have been influenced by visitors walking to the Cabot Circus installation.
Our Footfall & Insights pages are updated weekly with the latest footfall data. Please refer to our Reports & Resources section for a snapshot overview of footfall in our Monthly Visitor Reports and an overview of spend behaviours in our Quarterly Spend Reports.
The expanded footfall data can be viewed through our online dashboard for more effective and informed decision making. Please get in touch if you would like more information.
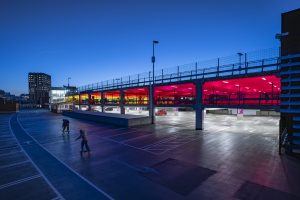
Main image: SHOTAWAY; in-text image 2: Andre Pattenden ; in-text image 3: Charles Emerson