16 Feb 2026
Monthly Footfall Overview: January 2026
Apart from Victoria Street, January experiences a slight decrease in footfall compared to December, however, visitor behaviour, spending power and visit frequency continue to offer valuable insights
Following our investment in Micro Location insights via O2/Virgin Media, two sensors have been installed on Victoria Street and Park Street*, allowing us to better understand footfall trends across the city.
We also capture data through two sensors in Broadmead, installed on Broadmead East and the corner of Broadmead West and Union Street. These sensors measure passing footfall by combining AI-powered algorithms with existing camera networks.
*due to an issue with the network during weeks 5 and 6 the full footfall and insights data for Park Street is unavailable for January 2026
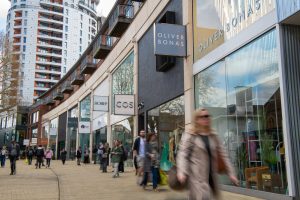
VICTORIA STREET
Overall trends
From December to January, footfall increased by 40%, with a 15% increase in visitor numbers.. The daily average visitor number was 6,328 in January compared to 4,459 in December. On top of a monthly increase, there was also a considerable 310% increase in visitors compared to January 2025 which stood at 2,036.
Key trends included:
- Seasonal events: Monday 19th to Wednesday 21st were the busiest days of the month. With the sensor located near a dense area of office buildings, this probably coincides with people returning into their offices after Christmas.
- Daily patterns: There is a pattern across the month of Sundays generally being the lowest day for footfall, comparable to December.
- International visits: footfall from international visits was slightly higher than in December, with the largest number of visitors from Spain.
Visitor Demographics & Behaviour
- A higher percentage of visitors were aged 18-54 compared to the national average, while fewer were 65+.
- 41% of visitors were female, compared to 51% nationally.
- The most popular time to visit Victoria Street was Tuesday to Friday lunchtimes between 1-2pm and after work between 5-6pm. Saturday afternoons saw a lower proportion of footfall than is usually the case.
- The average dwell time was 30 minutes, about 1 minute and a half longer than in December.
- ‘Workers’ (people whose location settings indicate they work and do not live around Victoria Street) account for 21% of footfall on weekdays, compared to 15% in December.
- The percentage or ‘out of area’ visitors (those visiting rather than working or residing nearby) was 64%, up from 70% in November.
Spending Power & Travel Patterns
- Compared to January 2025 and to the UK average, Victoria Street attracted a larger proportion of visitors with a ‘very high’ spend power.
- When comparing the spending power of different categories of visitor, ‘visitors’ account for the highest average spend power, followed by ‘Residents’ and then ‘Workers’.
- 64% of visitors made 1 visit, 29% made 2-5 visits, 5% made 6-10 visits, and 2% made 11+ visits, overall higher than in December.
- The BS4 postcode brought the highest number of visitors, followed by BS5.
- 66% of visitors to Victoria Street came from the Bristol area, 6% came from Bath postcodes and 3% from Gloucester postcodes.
Broadmead
Overall trends
The average daily footfall for Broadmead is divided between two sites: Broadmead East and 95 Broadmead.
The total footfall for January was 37% lower than for December, which is unsurprising as a lot of Christmas shopping would have taken place last month. In addition, Broadmead East saw a 2% lower footfall than January 2025, while 95 Broadmead saw 10% lower, meaning overall the footfall was 4% lower. Broadmead East accounted for 75% of the total footfall and 95 Broadmead accounted for 35%.
Key trends included:
- Saturday impact: clear spikes can be seen on Saturdays for both sites, with Saturday 31st being the busiest, which does not match the pattern seen in other areas of Bristol where footfall tailed off towards the end of January.
- Seasonal events: A decrease in visitor numbers compared to December 2025 is likely due to the absence of Christmas shopping, which would have impacted an increase of footfall in December.
Visitor Demographics & Behaviour
- The most popular time to visit Broadmead was Saturdays between 1-4pm and weekday lunchtimes between 1-2pm, though lunchtime was less popular than in December.
- Sundays were the quietest days.
Our Footfall & Insights pages are updated weekly with the latest footfall data. Please refer to our Reports & Resources section for a snapshot overview of footfall in our Monthly Visitor Reports and an overview of spend behaviours in our Quarterly Spend Reports.
The expanded footfall data can be viewed through our online dashboard for more effective and informed decision making. Please get in touch if you would like more information.