14 Jan 2026
Monthly Footfall Overview: December 2025
Overall, December experiences a slight decrease in footfall compared to November, however, patterns in visitor behaviour, spending power and visit frequency continue to offer valuable insights.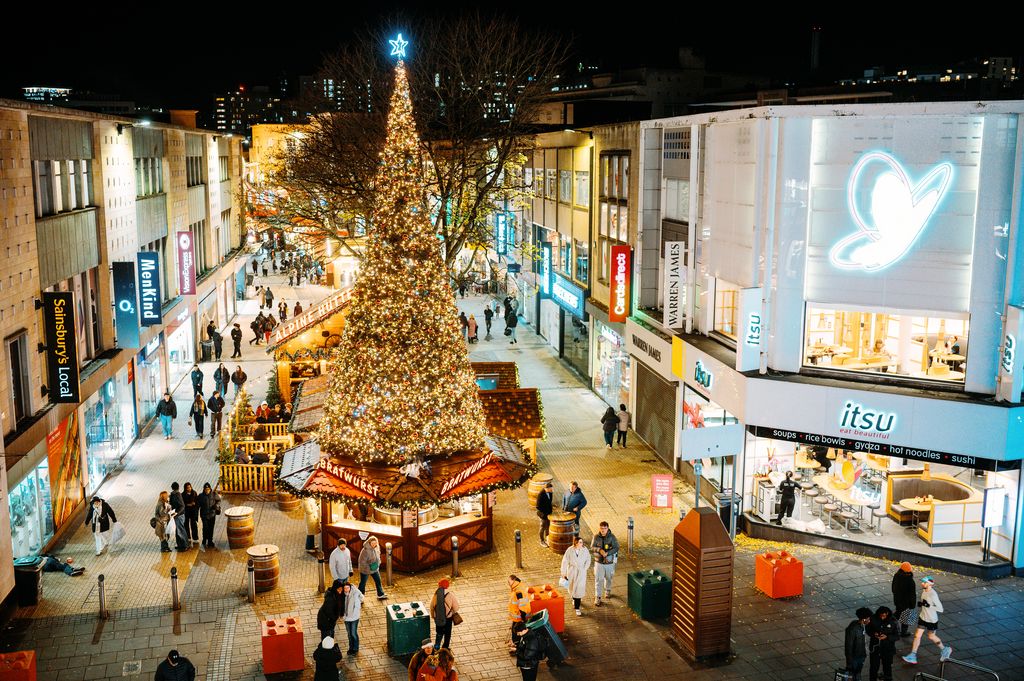
Following our investment in Micro Location insights via O2/Virgin Media, two sensors have been installed on Victoria Street and Park Street, allowing us to better understand footfall trends across the city.
We also capture data through two sensors in Broadmead, installed on Broadmead East and the corner of Broadmead West and Union Street. These sensors measure passing footfall by combining AI-powered algorithms with existing camera networks.
PARK STREET
OVERALL TRENDS
Compared to November, footfall on Park Street was down 5%. The daily average visitor number was 6,506 compared to 7,109 in November. There is also a 20% drop from December 2024, where the daily average was 8,048 visitors.
Key trends included:
- Seasonal events: The busiest day for footfall was Saturday 13th, followed by Friday 12th andSaturday 6th. Weekends in December are a very popular time to go out and celebrate. Christmas day had unsurprisingly very low footfall, with numbers slightly rising by New Year’s Eve, although numbers were still lower than other Wednesdays in the month.
- Saturday impact: Saturdays were the highest days for footfall, with consistent weekly footfall patterns emerging that highlight a notable spike on Saturdays.
- International visits: There was a 11% increase in footfall from international visitors compared to November, likely due to people traveling during the Christmas holidays, with the largest number of visitors from Spain.

VISITOR DEMOGRAPHICS & BEHAVIOUR
- A higher percentage of visitors were aged 18-64 compared to the national average, while fewer were 65+.
- The most popular time to visit Park Street was 2-5pm on Saturdays, and 5-6pm on Tuesdays and Thursdays, coinciding with after work drinks.
- 43% of visitors were female compared to 51% nationally.
- ‘Out of area’ visitors (those visiting rather than working or residing nearby) made up 68% of visits, which is the same as in November. However on the three busiest Saturdays, this rose to 72%, showing weekend visits are particularly driven by out-of-area audiences.
- Saturday afternoon and into the evenings was the most popular time for out-of-area visitors.
- The average dwell time was around 23 minutes, which is comparable to November.
SPENDING POWER & TRAVEL PATTERNS
- Compared to the UK average, Park Street visitors had a ‘high’ or ‘very high’ spending power. Despite this, a larger proportion of visitors had ‘very low’ spend power compared to those visiting Park Street in December 2024.
- When comparing the spending power of different categories of visitor, ‘residents’ had the highest average, followed by ‘visitors’ and then ‘workers’.
- 72% of visitors made 1 visit, 27% made 2-5 visits, 1% made 6-10 visits and no visitors over 11 times. This aligns with a slight decrease in the average number of visits per person from November.
- The BS8 postcode brought the highest number of visitors to Park Street, followed by BS6.
- 3% of visitors came from Bath and 2% came from Gloucester postcodes.
VICTORIA STREET
OVERALL TRENDS
From November to December, footfall decreased by 7%. The daily average visitor number was 4,459 in December compared to 4,931 in November. Despite a slight decrease since the month before, there has been a considerable increase in visitor numbers compared to December 2024 which stood at 1,621.
Key trends included:
- Seasonal events: Wednesday 10th to Saturday 13th were the busiest days of the month, which likely coincides with office parties taking place as the area is heavily populated by office buildings.
- Daily patterns: There is a pattern across the month of Sundays generally being the lowest day for footfall, aside from Christmas day which was easily the lowest of the month.
- International visits: Footfall from international visits was almost the same as November, with the largest number of visitors from Spain.
VISITOR DEMOGRAPHICS & BEHAVIOUR
- A higher percentage of visitors were aged 18-64 compared to the national average, while fewer were 65+.
- 43% of visitors were female, up from 41% and compared to 51% nationally.
- The most popular time to visit Victoria Street was Monday to Wednesday lunchtimes between 1-2pm and after work between 5-6pm. Saturdays between 2-6pm was also a popular time to visit.
- The average dwell time was 28 and a half minutes, about 2 minutes lower from November.
- ‘Workers’ (people whose location settings indicate they work and do not live around Victoria Street) account for 16% of footfall between Monday-Thursday, but only 12% on Fridays, showing that Friday was the least popular day to go into the office.
- The percentage or ‘out of area’ visitors (those visiting rather than working or residing nearby) was 70%, up from 69% in November.
SPENDING POWER & TRAVEL PATTERNS
- Compared to December 2024 and to the UK average, Victoria Street attracted a larger proportion of visitors with a ‘high’ or ‘very high’ spend power.
- When comparing the spending power of different categories of visitor, ‘visitors’ account for the highest average spend power, followed by ‘Residents’ and then ‘Workers’.
- 71% of visitors made 1 visit, 25% made 2-5 visits, 3% made 6-10 visits, and 1% made 11+ visits, overall slightly lower than in November.
- The BS4 postcode brought the highest number of visitors, followed by BS3.
- 64% of visitors to Victoria Street came from the Bristol area, up from 59% in November. 5% came from Bath postcodes and 3% from Gloucester postcodes.
BROADMEAD
OVERALL TRENDS
The average daily footfall for Broadmead is divided between two sites: Broadmead East and 95 Broadmead.
In December, the total footfall was 2% lower than November, however this is partly explained by a big drop on Christmas day, which can’t be compared to other months. Despite this, Broadmead East saw a 2% higher footfall than December 2024, while 95 Broadmead saw 3% lower, meaning overall the numbers were very similar to December 2024. Broadmead East accounted for 81% of the total footfall and 95 Broadmead accounted for 19%.
Key trends included:
- Saturday impact: Saturdays were the highest day for footfall for both sites, with Saturday 13th being the busiest, comparable to the data collected from Park Street and Victoria Street.
- Seasonal events: Looking at just the 1st to the 24th December, there was a 7% increase in footfall compared to 1st to 24th November. This increase coincides with the Christmas market, which ran from the 7th November to the 23rd December, and nearby Christmas village which would have most likely attracted visitors.
VISITOR DEMOGRAPHICS & BEHAVIOUR
- The most popular time to visit Broadmead was Saturdays between 1-4pm and weekday lunchtimes between 1-2pm, which suggests a lot of people go to the shops on their lunch break.
- Thursdays were the quietest days.
- There is a more even spread of footfall across the week this year – last year saw bigger spikes on Saturdays and lower proportions in the week.
Our Footfall & Insights pages are updated weekly with the latest footfall data. Please refer to our Reports & Resources section for a snapshot overview of footfall in our Monthly Visitor Reports and an overview of spend behaviours in our Quarterly Spend Reports.
The expanded footfall data can be viewed through our online dashboard for more effective and informed decision making. Please get in touch if you would like more information.